
Throughput is one of the most misunderstood performance testing concepts new testers sometimes struggle with. So what is throughput?
Here are the three best definitions of throughput:
- Basically, “Throughput” is the number of transactions produced over time during a test.
- It’s also expressed as the amount of required capacity that a website or application can handle.
- Also, before starting a performance test run, it is common to have a throughput goal that the application needs to be able to handle a specific number of requests per hr.
Read on to learn more about:
- A brief overview of throughput
- How to measure throughput in your performance tests
- Examples of throughput in practice
INDEX
Let's Imagine Throughput in the Real World

For example: Imagine a gas station attendant filling up a car's gas tank using a gas pump.
Let’s also say that it always takes the gas attendant just one minute to fill up any car, no matter how big it is or how low the car's gas tank is.
Let’s call this gas station “Joe’s Gas” and envision that it only has three gas pumps. Naturally, if we have three gas pumps and three cars, it follows that Joe's attendants can only fill up three cars per minute.
So, if we were to fill out a performance report for Joe's gas station, it would show that Joe’s throughput is three cars per minute.
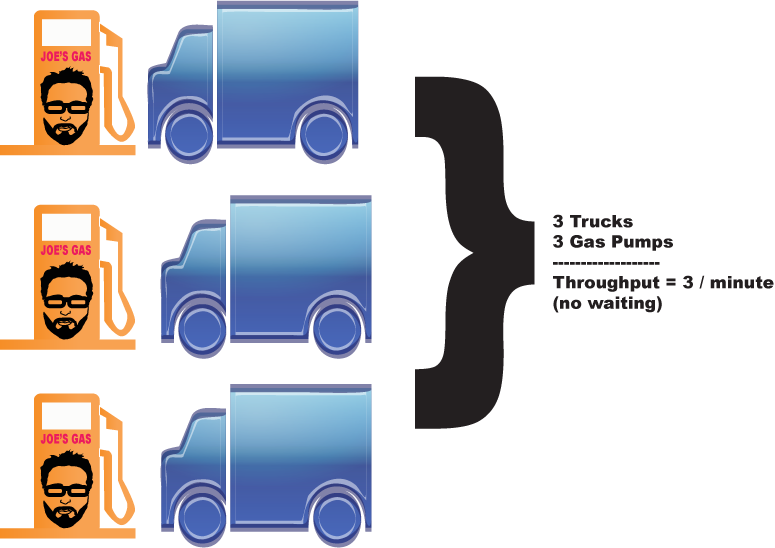
This is Joe’s dilemma: no matter how many cars need gas, the maximum number that can be handled during a specific time frame will always be the same –three.
This is our maximum throughput; it is a fixed upper-bound constraint.
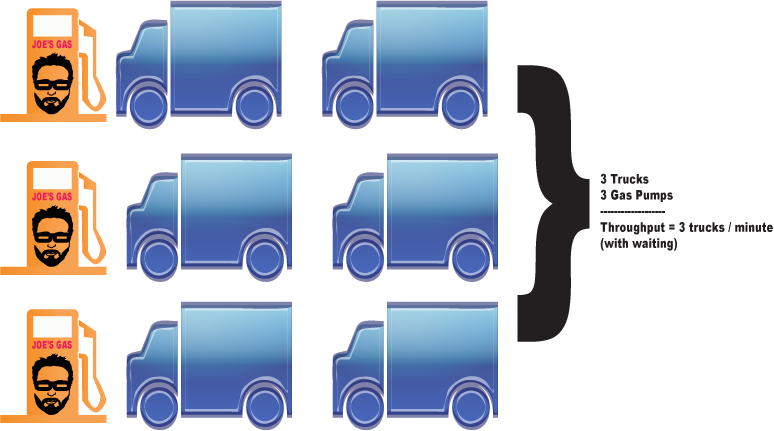
As more vehicles enter the gas pump line, they are required to wait, thus creating a queue.
It is the same concept that applies if we are testing a web application. If a web app receives 50 requests per second but can only handle 30 transactions per second, the other 20 requests end up waiting in a queue.
In short, actual throughput in performance testing is often expressed as transactions per second or TPS.
Automation Testing Free Courses
Real Performance Testing Throughput Results
I use HP's LoadRunner (which comes with a throughput monitor) for performance testing. But other tools like jMeter have similar meters.
In a typical test scenario, these would definitely happen:
- As users begin ramping up and making requests, the throughput created will increase as well.
- Once all users are logged in and processing in a steady state, the throughput will even out since the user load test stays relatively constant.
- If we wanted to find an environment’s throughput upper bound, we would continue increasing the number of users.
- Eventually, after a certain amount of users are added, the throughput will start to even out and may even drop.
- However, if the throughput enters this state, it is usually due to some kind of bottleneck in the application.
Get TestGuild Partnership Plans
A Look at Typical Throughput Results
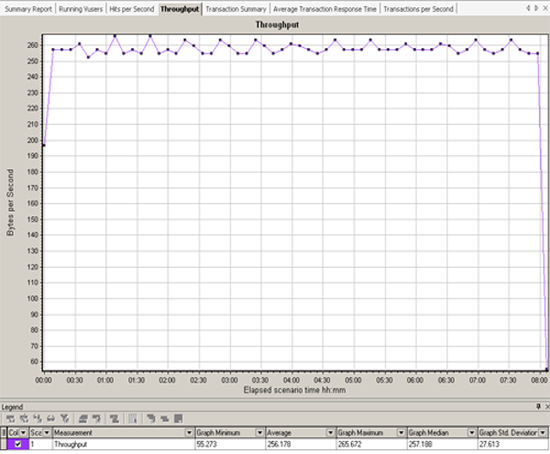
Below are the LoadRunner throughput chart results for a 25-user test that I recently ran.
Test #1
Notice that once all 25 concurrent users are logged in and doing work, the throughput stays fairly consistent. This is expected.
Test #2
Now notice what throughput looks like on a test that did not perform as well as in the last example.
All users login and start working; once all users are logged in and making requests, you would expect the throughput to flatline.
But in fact, we see it plummet. This is not good.
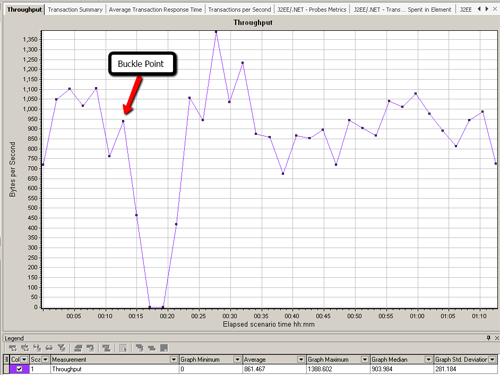
As I mentioned earlier, throughput behavior like the above example usually involves a bottleneck.
Test #3
By overlaying the throughput chart with an HP Diagnostics ‘J2EE – Transaction Time Spent in Element’ chart, we can see that bottleneck appears to be in the database layer:
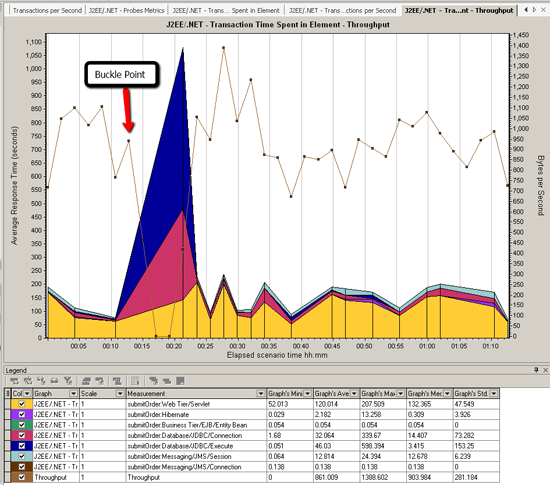
In this particular test, requests were being processed by the web server. But in the back end, work was being queued up due to a database issue.
As additional requests were being sent, the back-end queue kept growing, and users’ response times increased.
To learn more about HP Diagnostics, check out how I configured LoadRunner to be able to get these metrics in my video: HP Diagnostics – How to Install and Configure a Java Probe with LoadRunner.
What factors contribute to degraded network throughput and latency?
Several factors contribute to degraded network throughput and latency in a network environment.
Degraded network throughput can result from hardware issues, such as using obsolete routers or devices that are faulty, which can hinder the efficient flow of data. Additionally, heavy network traffic can lead to packet loss, further impacting network throughput.
On the other hand, network latency can be influenced by various elements within the network infrastructure. Propagation delay occurs as packets travel from one point to another at the speed of light. The transmission medium, whether it is optical fiber, wireless, or another type, introduces delays that can vary based on the specific medium used.
The size of packets also affects latency, with larger packets taking more time to transmit and receive compared to smaller ones. Furthermore, the use of repeaters to amplify signals can introduce additional latency.
Moreover, the processing time of routers plays a role in network latency as gateway nodes need to inspect and potentially modify packet headers, affecting the overall transmission speed. Computer and storage delays may occur within networks, with intermediate devices like switches and bridges potentially causing delays due to storage and hard disk access processes. It is important to note that backbone statistics may not always consider these types of latency factors, which could impact network performance.
What tools are available for measuring and monitoring network throughput?
Various tools are available for measuring and monitoring network throughput. These tools serve different purposes and cater to various preferences.
Some commonly used tools include Simple Network Management Protocol (SNMP), Windows Management Instrumentation (WMI), tcpdump, and Wireshark.
- SNMP, an application-layer protocol, is utilized for managing and monitoring network devices and their operations, providing a universal language for devices to communicate management information in both single- and multivendor environments. The latest version, SNMP version 3, boasts advanced security enhancements ensuring the authentication, encryption, and protection of SNMP messages during transmission.
- WMI, a set of specifications developed by Microsoft, aids in centralizing the management of devices and applications within a network powered by Windows systems. WMI grants users access to vital information concerning the status of local or remote computer systems, facilitating a range of actions like configuration, security settings, permissions, error logging, and much more.
- Tcpdump, an open-source command-line tool, is instrumental in monitoring and capturing network traffic, displaying packet headers for analysis and comparison against specific criteria. Capable of recognizing boolean search operators, tcpdump allows for filtering based on host names, IP addresses, network names, and protocols.
- Wireshark is another noteworthy open-source tool for network traffic analysis, offering insight into various details such as transmit time, protocol type, header data, source, and destination information. It is commonly employed by network and security teams to evaluate security incidents and debug network-related challenges effectively.
Also many performance testing tooling capture this data as well but may call it request per second. For example the load testing tool k6, throughput is measured in requests per second.
What is Throughput Recap

To recap: Throughput is a key concept for good performance testers to understand and is one of the top metrics used to measure how well an application is performing.
I've also written some other posts on other concepts that a performance test engineer should know about:
- What is resource utilization?
- What are concurrent users?
- What is the Response time?
- Performance Testing Basics – Four Steps to Performance Nirvana
Extra Performance Testing Awesomeness for your Ear Buds
For more detailed info on performance testing, make sure to grab a copy of the Performance Analysis for Java(TM) Websites. Also, make sure to check out some interviews with some of the biggest names in performance testing to discover even more performance testing awesomeness on our TestGuild Performance & SRE Podcast.


Excellent. It helped me to understand with the simple examples and the visual graphs.
TM » Thanks! I really appreciate your feedback. It helps me in planning what types of future post I should focus on. Cheers~Joe
Hi Joe, thank you for the explanation on throughput. I really like the gas station analogy. I have another basics question though. How would you define SLAs when developing a performance test plan? How much throughput is good, what is acceptable CPU on servers etc. I know there is no one size fits all, but if you can give some examples similar to the gas station analogy, would appreciate it. Thanks.
Haris » Thanks Haris! I’ll try to see what I can put together for an SLA post. Thanks for the idea ~Cheers Joe
Hi,
i would like to know…What is pacing?why pacing should be given between iteration or what if pacing is not given…
Thanks in advance.
shailesh » Hi Shailesh – Good question – I think this quy can explain it better than me:. Hope it helps. Cheers~Joe
Shailesh,
Pacing is the time you wait between iterations.
BTW this is a great article JOE.
Thanks Shailesh! I like your pithy definition for pacing :) Cheers~Joe
Thanks for the article. It’s really helpful !!
Paul » Thanks Paul – I’m glad it helped you! Cheers~Joe
Nice article. I do have one question.i was going through the Loadrunner training manual and in that it mentions “If throughput has flattened out while the number of Vusers increase, there is a likely a bandwidth issue.” But i feel your explanation is more correct. can you please shed some views on this?
Hi Joe, I woulld like to know that, what are techniques or methods that can be used to evaluate throughput in terms of computing ? [I am a Computer Science Honours student (South Africa), and currently doing something on throughput evaluation ]
Mathews » Hi – First I would use a performance test tool like LoadRunner,SoaSta, Grinder or JMeter to place a load against the test system. I would start with one user and increase the user load by small increments until I found the throughput plateau. I consider a plateau to be the point where either the throughput really falls off or the response time is well over what is acceptable for my requirements.That’s it in a nutshell – this may be to basic for your needs.
i want to know that what is throughput out and throughput in.
one think i must tell you, your way of explaining is toooooo good.
fazal » Thanks Fazal.
Thanks Joe for this wonderful post, it helped me a lot.
However it is clear to me but I just wanted to confirm that throughput(It is also a term in Argeegate Report(Listener) of Apache Jmeter) is same as processing rate of requests, a high throughput means high performance, Right?
Abhinav » Hi Abhinav yes the throughput on the JMeter Aggregate_Report is the same. Not sure I would go as far as to say that high thoughput = high performance. Its one factor in many that needs to be looked at when performance testing an application. Cheers~Joe
Hi everyone…
What is ADHOC testing and when & why this testing is done?
Thanks,
Nikhil
nikhil » Hi Nikhil – Ad hoc testing is a commonly used term for software testing performed without planning and documentation. Ad hoc testing is an informal test and usually is a test that is only run once
Excellent Stuff. Finally I am able to understand throughput now.
Abhishek » Thanks Abhishek! Let me know if there are other performance concepts you want me to blog about. Cheers~Joe
Excellent article Joe it made things easy for me
how many users should i use if my Target is 0.7 TPS
and is it different if i call a webservice via soapUI
Murali » Thanks Murali – its hard to tell without knowing how much wait time you have between transaction and the amount of time your response is for 1 user. You should try to get a handle on how many users the business expects and then try to create a realistic scenario emulating that to check your TPS. Good Luck~Joe
Thank you, Joe! I like comparison with gas station)))).
BTW, what do you advise to start from when analyzing results?
Do you use the same approach as in the article from below?
http://blazemeter.com/blog/how-analyze-results-large-scale-load-test
good article. it is very helpful
thanqs joe.
waasay » Thanks!
HI Joe,
Thanks a lot for providing this nice information. Its the best article I have ever went through with very simple and elaborative examples. Its really helpful. Can you please publish few more similar articles on most important LoadRunner monitors like Hits per Seconds, Average Transaction Response Time etc.?
Sajid » Thanks Sajid! I’ll try to write some more post similar to this. I usually only write about what I’m currently working on but I will try to focus more on LR again. Cheers~Joe
Hi Joe,
Very Nice article with lot of information. Please Provide more information on performance testing with LR.
Shiv Raj Sharma » Thanks! I’ll try to write more post on LoadRunner :)
JOE>> This is a very good portal for performance testing. Well Done!!!!!!!!
Thanks Anoop!
Appreicative – very informative :-)
I am using 9.1 loadrunner, how do we get – HP Diagnostics ‘J2EE – Transaction Time Spent in Element’ graph which show database/appserver in our case.
Vinod » Thanks! Do you have a license for HP Diagnostics?
Thanks a lot ….Joe’s gas gave a good understanding of throughput.
Shinto Abraham M.A » Great!
Amazing! you are doing great job for learner
Syed » Thanks Syed!
Thanks joe for the information pertaining to Throughput.
I have one query After the test is done we can get the total throughput value in bytes and my question is whether we can get the throughput value for a single request.(Example for a single login request how can we measure the throughput value.)
Thanks In Advance.
Great Article Joe.
Mukundan » Thanks!
Hi Joe,
Appreciate the way you explained Throughput.
I have one question:
What is the difference between Think Time and Pacing, if we give think time before “return 0” in script then it will also work like pacing, then wats the difference?
Ravi Ranjan » Thanks Ravi! Checking out Oliver Lloyds excellent explanation of pacing vs think time:
http://h30499.www3.hp.com/t5/LoadRunner-Support-Forum/Think-Time-vs-Pacing/td-p/2392288
Excellent Joe, you have simplified the concept with better understanding
thanks joe, it is reallu useful for understanding what throughput is.
thanks, really useful
Hey
i wanted to know that if increase the threads in each run and also the ramp up time
i.e 1st run threads :5 ramp up time is 10 sec
2nd run threads :10 ramp up time :20 sec
the throughput and bandwidth will also increase?
Very Informative article!!! Thanks Joe!
I have a query,we are using LR11. Could u please tell me how to calculate pacing time and what is its significance? should we include Think time as well in pacing time or not?
Thanks!
Shraddha » Hi Shraddha – Check out Oliver Lloyds response in the HP forum question Think Time vs Pacing – I dont think I could explain it better than him:)
Hi Joe,
Its a excellent post, and helped me a lot .. could you please explain the relation between hits/sec, response time and throughput……as I am seeing a lot of people saying different views about this ..
Very nice example…..good way to present the basic concepts….
Thank you Soo much.Really useful information
HI Joe,
I read the article, you explained very well about throughput. Than you so much. But i did not understand what is the database issue. which database counter you measured for throughput. If you don’t mind can you elaborate in detail the ” back end work was being queued up due to a database issue”.
Regards,
Ramamurthy P
Hi Ramamurthy – if I remember correctly this issue was that the web server was sending request to the DB but the DB was too busy trying to fulfill previous request. Because of this all the request where building up in a queue. The web servers Processor Queue Length kept increasing which was a clue to me that something was happening on the DB side. I had a db administrator monitor the DB as the test ran to pinpoint what was happening.
Hi, I need full process of Performance testing and how to do that for single user and 5 user. Thanks
HI Joe,
Nice blog…
I have a question… If the hits per sec is high and the throughput is low,what does it mean?
Joe-Thank you so much for reply.
Anitha- Below are the points two cause the low throughtput
1. Network bandwidth- constraint. beacuse htis/sec increases as vusers increase also throughtput also increase. but throughput decreases means shortage in the network bandwith or more utilization or crossing the limit of bandwidth.
2. Less number configeration of thread pools.
3. CPU utlization reached more than 90%.
Please correct if i am worng for above points regarding the throughtput decrease eventhough Hits/sec increases.
Regards,
Ramamurthy P
i have one doubt in load runner?
if we increase the through put, should the response time take more time?
Depends – in general I would say eventually yes as your throughput goes up response time usually goes up as well once the server’s resources start to get heavily utilized.
Hi Joe
whenever you do a performance for a website
which of the following types of testing u normally perform in every iteration
Load
Stress
Scalablity
Volume
Endurance
BTW awesome website man..
Hi Gaurav – great question but its hard to answer other then it depends. I think at a minimum you want to do some kind of Load test to make sure that performance has not changed from the previous release. Also you want to do performance testing as early as possible.
Very good article…thanks joe. I am very big fan of all ur posts
Thanks Shafee!!
Nice post
Joe …Thankyou verymuch for this excellent article.
Hi Joe,
That was a nice post on throughput, but one thing i am not clear about is the difference between throughput and hits/sec. Are these same? If not, what is the difference?
Cheers
Akshay
Hi Joe,
I am doing performance testing for an application where I need to check system behavior based on the number of records generated.For example, manually I have verified that from 1-Apr-2014 to 30-Apr-2014, no of records generated is 35000,again from 3rd Apt-2014-15-Apr-2014 , no of records generated is 18000. So for me increasing the Thread count won’t probably solve the purpose. What I am doing is changing the date ranges in my script and noting the performance. Is there a better way to do this.i am using Jmeter
Hi Joe,
I am new to performance testing. I want to learn scripting in Load runner. I have intermediate knowledge of c language. Could you please let me know what should be my next step (resources or websites i should refer to, any dumps or examples which i can refer to)? Also, what should i refer to be able to learn performance tuning?
Thanks in advance for your help! Your posts are really helpful…
Regards,
Rahul
Hi Rahul I would first check out the podcast PerfBytes which is hosted by Mark Tomlinson and James Pulley. Between the two of them they have more then 40 years or performance testing experience.
I want to know if thoughput in JMeter consist of network latency or just pure server throughput?
I know ideally we should run perf test from LAN to avoid network latency. But I am testing web app which is hosted on cloud. Cant skip network latency.
Hi joe,
It was nice seeing all ur posts..very much helpful for performance testing..am new to performance testing and m keen to understand the basic concepts that we use to run the test..it would b helpful if u could giv answers for the below query
1. If my goal is transaction per second in goal oriented scenario how do I set up a minimum and maximum users (I mean on what basis)
2. Am facing performance issue while I run a load test for the target tps 25, am not able to reach more than 11 tps and my response time is also keep increasing where it should b 0.5 sec on average as per business requirement..I doubt it could b due to threads but not sure of exactly.
Please do the needful
Thanks
Hi Joe,
I have been reading through the QAs and finding it very helpful. I just started to learn about performance testing.
I am looking for a good blog/video on correlation and parametization. Can you suggest some?
Thanks
Thannks! Does this help: https://www.youtube.com/watch?v=xQXfNBaHclQ ?
Very specific and easy to understand.helped me a lot.
Thanks and keep it going!!
Very Nice Post. Thank you for posting this with simple example. Could you please post “Performance testing stages using Jmeter”. I really want to know the exact process of performance testing using Jmeter.
Excellent explanation
Hi Joe, This article has a conceptual error. Throughput in any other form of testing may be defined as number of transactions executed per second, but when it comes to Performance testing, Throughput is defined as Bytes transferred per second. LoadRunner defines it as Bytes Received per second. But since the number of transactions per second is most probably directly proportional to Bytes Received per second (Not always), your analysis to the said still holds good in that direction. But I wanted to point that the Throughput definition you have mentioned has been misleading and other viewers of this blog seem to buy this. May be a honest overlook from your side. Hope you will correct it.
Hi Joe,
What is difference between throughput ,transaction response time and Hits per second
Excellent article I’ve ever read to understand throughput.
Hi Joe,
Nice post..however I have a question related to my application.
In my application there are 4 different scenarios which we have covered, for one of the particular scenario (GUI ) the hits per second and throughput are coming zero.
Similarly in my second project also which is a desktop based application the hits per second and throughput is coming zero as well.
Is there any concept that for any desktop based or GUI application these parameters will remain zero?
Please suggest your views.
Very specific and easy to understand.helped me a lot.
Thanks and keep it going!!